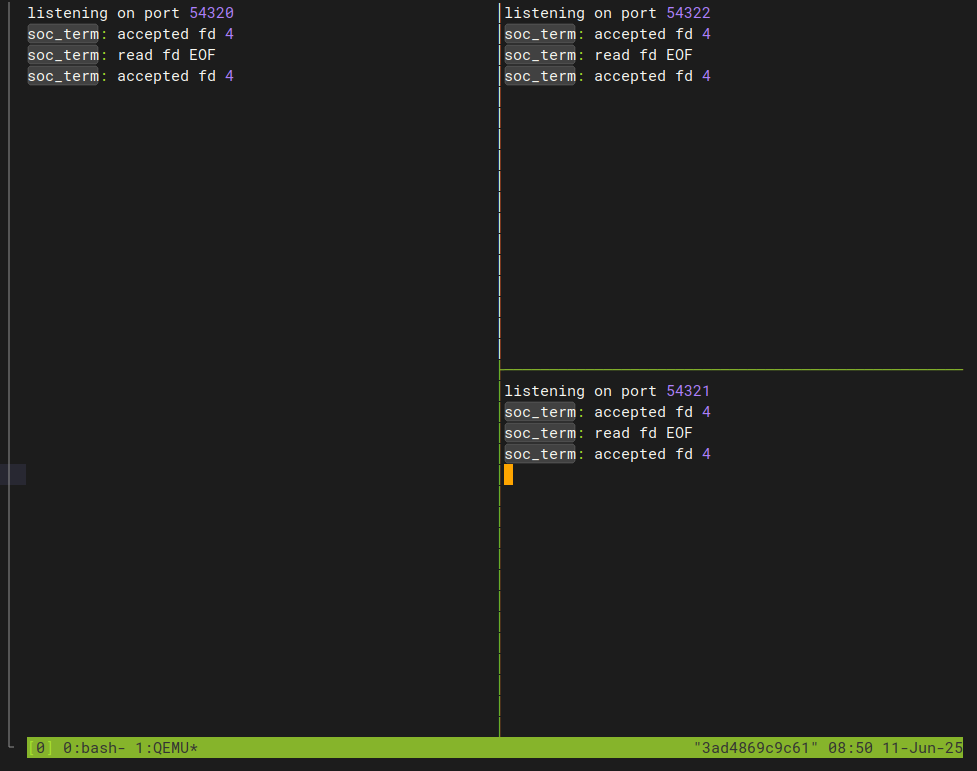
首页
关于
友链
其它
统计
壁纸
Search
1
修改Linux Kernel defconfig的标准方法
5,467 阅读
2
Android系统之VINTF(1)manifests&compatibility matrices
4,950 阅读
3
cgroup--(4)cgroup v1和cgroup v2的详细介绍
4,950 阅读
4
c语言的__attribute__
2,969 阅读
5
Android系统之VINTF(3)Matching Rules
2,366 阅读
默认分类
文章收集
学习总结
每天一刷
环境配置
知识点
入门系列
vim
shell
Git
Make
Android
Linux
Linux命令
内存管理
Linux驱动
Language
C++
C
工具
软件工具
Bug
登录
Search
标签搜索
shell
Linux
c
uboot
Vim
vintf
Linux驱动
Android
device_tree
git
DEBUG
链表
数据结构
IDR
内核
ELF
gcc
网址
内存管理
进程管理
adtxl
累计撰写
342
篇文章
累计收到
8
条评论
首页
栏目
默认分类
文章收集
学习总结
每天一刷
环境配置
知识点
入门系列
vim
shell
Git
Make
Android
Linux
Linux命令
内存管理
Linux驱动
Language
C++
C
工具
软件工具
Bug
页面
关于
友链
其它
统计
壁纸
搜索到
109
篇与
的结果
2024-01-09
Android sensor hal框架
1. 简介2. 驱动大部分传感器都会使用iio驱动框架,以light sensor为例3. sensor hal3.1 sensor hal 2.0接口sensor hal 2.0的几个接口说明,参考ISensors.halgetSensorsList()getSensorsList() generates (vec<SensorInfo> list);getSensorsList()函数用于获取当前设备的所有可用的sensors,返回值为SensorInfo,该结构体定义如下,struct SensorInfo { /** * handle that identifies this sensors. This handle is used to reference * this sensor throughout the HAL API. */ int32_t sensorHandle; /** * Name of this sensor. * All sensors of the same "type" must have a different "name". */ string name; /** vendor of the hardware part */ string vendor; /** * version of the hardware part + driver. The value of this field * must increase when the driver is updated in a way that changes the * output of this sensor. This is important for fused sensors when the * fusion algorithm is updated. */ int32_t version; /** this sensor's type. */ SensorType type; /** * type of this sensor as a string. * * When defining an OEM specific sensor or sensor manufacturer specific * sensor, use your reserve domain name as a prefix. * e.g. com.google.glass.onheaddetector * * For sensors of known type defined in SensorType (value < * SensorType::DEVICE_PRIVATE_BASE), this can be an empty string. */ string typeAsString; /** maximum range of this sensor's value in SI units */ float maxRange; /** smallest difference between two values reported by this sensor */ float resolution; /** rough estimate of this sensor's power consumption in mA */ float power; /** * this value depends on the reporting mode: * * continuous: minimum sample period allowed in microseconds * on-change : 0 * one-shot :-1 * special : 0, unless otherwise noted */ int32_t minDelay; /** * number of events reserved for this sensor in the batch mode FIFO. * If there is a dedicated FIFO for this sensor, then this is the * size of this FIFO. If the FIFO is shared with other sensors, * this is the size reserved for that sensor and it can be zero. */ uint32_t fifoReservedEventCount; /** * maximum number of events of this sensor that could be batched. * This is especially relevant when the FIFO is shared between * several sensors; this value is then set to the size of that FIFO. */ uint32_t fifoMaxEventCount; /** * permission required to see this sensor, register to it and receive data. * Set to "" if no permission is required. Some sensor types like the * heart rate monitor have a mandatory require_permission. * For sensors that always require a specific permission, like the heart * rate monitor, the android framework might overwrite this string * automatically. */ string requiredPermission; /** * This value is defined only for continuous mode and on-change sensors. * It is the delay between two sensor events corresponding to the lowest * frequency that this sensor supports. When lower frequencies are requested * through batch()/setDelay() the events will be generated at this frequency * instead. * It can be used by the framework or applications to estimate when the * batch FIFO may be full. * * NOTE: periodNs is in nanoseconds where as maxDelay/minDelay are in * microseconds. * * continuous, on-change: maximum sampling period allowed in * microseconds. * * one-shot, special : 0 */ int32_t maxDelay; /** Bitmask of SensorFlagBits */ bitfield<SensorFlagBits> flags; }; setOperationMode()setOperationMode设置模块的模式,有两种选择,SENSOR_HAL_NORMAL_MODE - Normal operation. Default state of the module.SENSOR_HAL_DATA_INJECTION_MODE - Loopback mode.Data is injected for the supported sensors by the sensor service in this mode.setOperationMode(OperationMode mode) generates (Result result);activate()activate()用来activate/de-activate一个sensor,在de-activate一个sensor后,尚未写入事件队列的现有传感器事件必须立即丢弃,以便后续的激活不会得到陈旧的传感器事件(即在后续激活之前生成的事件)。enabled设置为true激活一个传感器,设置为false停用一个传感器。activate(int32_t sensorHandle, bool enabled) generates (Result result);initialize()initialize()函数用于初始化hal的快速消息队列Fast Message Queues (FMQ)和回调函数。快速消息队列(FMQ)用于在框架和HAL之间发送数据。回调由HAL用于通知框架异步事件,例如动态传感器的连接。事件FMQ用于将传感器事件从HAL传输到框架。使用 eventQueueDescriptor 创建事件FMQ。只能将数据写入事件FMQ,不得从事件FMQ读取数据,因为框架是唯一的读取者。收到传感器事件后,HAL将传感器事件写入事件FMQ。一旦HAL完成将传感器事件写入事件FMQ,HAL必须通知框架可以读取和处理传感器事件。有两种方式实现:调用事件FMQ的 EventFlag::wake() 函数,使用 EventQueueFlagBits::READ_AND_PROCESS在事件FMQ的 writeBlocking() 函数中将写通知设置为 EventQueueFlagBits::READ_AND_PROCESS。// Initialize the Sensors HAL's Fast Message Queues (FMQ) and callback. // @param eventQueueDescriptor Fast Message Queue descriptor that is used to // create the Event FMQ which is where sensor events are written. The // descriptor is obtained from the framework's FMQ that is used to read // sensor events. // @param wakeLockDescriptor Fast Message Queue descriptor that is used to // create the Wake Lock FMQ which is where wake_lock events are read // from. The descriptor is obtained from the framework's FMQ that is // used to write wake_lock events. // @param sensorsCallback sensors callback that receives asynchronous data // from the Sensors HAL. // @return result OK on success; BAD_VALUE if descriptor is invalid (such // as null) @entry @callflow(next = {"getSensorsList"}) initialize(fmq_sync<Event> eventQueueDescriptor, fmq_sync<uint32_t> wakeLockDescriptor, ISensorsCallback sensorsCallback) generates (Result result);batch()设置传感器的参数,包括采样频率和最大报告延迟。此函数可在传感器处于激活状态时调用,此时不能导致任何传感器测量数据的丢失:从一个采样率过渡到另一个采样率不能导致事件丢失,也不能从高最大报告延迟过渡到低最大报告延迟导致事件丢失。/* @param sensorHandle 要更改的传感器句柄。 @param samplingPeriodNs 指定传感器样本周期,以纳秒为单位。 @param maxReportLatencyNs 在事件被采样到报告时间之前允许的延迟时间。 @return 成功时返回 OK,如果任何参数无效则返回 BAD_VALUE。 */ batch(int32_t sensorHandle, int64_t samplingPeriodNs, int64_t maxReportLatencyNs) generates ( Result result); flush()刷新将向指定传感器的“批处理模式”FIFO末尾添加一个 FLUSH_COMPLETE 元数据事件,并刷新FIFO。如果FIFO为空或传感器不支持批处理(FIFO大小为零),则返回 SUCCESS,并在事件流中添加一个简单的 FLUSH_COMPLETE 事件。这适用于除单次触发传感器之外的所有传感器。如果传感器是单次触发传感器,刷新必须返回 BAD_VALUE,并且不生成任何刷新完成的元数据。如果在调用 flush() 时传感器处于非活动状态,flush() 必须返回 BAD_VALUE。// Trigger a flush of internal FIFO. flush(int32_t sensorHandle) generates (Result result);injectSensorData()当设备处于 NORMAL 模式时,调用此函数将操作环境数据推送到设备。在此操作中,事件始终为 SensorType::AdditionalInfo 类型。当设备处于 DATA_INJECTION 模式时,此函数还用于注入传感器事件。无论 OperationMode 如何,注入的 SensorType::ADDITIONAL_INFO 类型事件不应路由回传感器事件队列。// Inject a single sensor event or push operation environment parameters to device. injectSensorData(Event event) generates (Result result);registerDirectChannel()使用提供的共享内存信息注册直接通道。在返回时,传感器硬件负责将内存内容重置为初始值(取决于内存格式设置)。// Register direct report channel. registerDirectChannel(SharedMemInfo mem) generates (Result result, int32_t channelHandle); SharedMemInfo结构体定义如下, /** * Shared memory information for a direct channel */ struct SharedMemInfo { SharedMemType type; // shared memory type SharedMemFormat format; uint32_t size; // size of the memory region, in bytes handle memoryHandle; // shared memory handle, it is interpreted // depending on type field, see SharedMemType. }; /** * Direct channel shared memory types. See struct SharedMemInfo. */ @export(name="direct_mem_type_t", value_prefix="SENSOR_DIRECT_MEM_TYPE_") enum SharedMemType : int32_t { // handle contains 1 fd (ashmem handle) and 0 int. ASHMEM = 1, // handle definition matches gralloc HAL. GRALLOC }; /** * Direct channel lock-free queue format, this defines how the shared memory is * interpreted by both sensor hardware and application. * * @see SharedMemInfo. */ @export(name="direct_format_t", value_prefix="SENSOR_DIRECT_FMT_") enum SharedMemFormat : int32_t { SENSORS_EVENT = 1, // shared memory is formated as an array of data // elements. See SensorsEventFormatOffset for details. // Upon return of channel registration call, the // shared memory space must be formated to all 0 by HAL. };unregisterDirectChannel()注销先前使用 registerDirectChannel 注册的直接通道,并移除在该直接通道中配置的所有活动传感器报告。// Unregister direct report channel. unregisterDirectChannel(int32_t channelHandle) generates (Result result);configDirectReport()此函数启动、修改速率或停止在特定直接通道中传感器的直接报告。// Configure direct sensor event report in direct channel. configDirectReport( int32_t sensorHandle, int32_t channelHandle, RateLevel rate ) generates ( Result result, int32_t reportToken); /** * Direct report rate level definition. Except for SENSOR_DIRECT_RATE_STOP, each * rate level covers the range (55%, 220%] * nominal report rate. For example, * if config direct report specify a rate level SENSOR_DIRECT_RATE_FAST, it is * legal for sensor hardware to report event at a rate greater than 110Hz, and * less or equal to 440Hz. Note that rate has to remain steady without variation * before new rate level is configured, i.e. if a sensor is configured to * SENSOR_DIRECT_RATE_FAST and starts to report event at 256Hz, it cannot * change rate to 128Hz after a few seconds of running even if 128Hz is also in * the legal range of SENSOR_DIRECT_RATE_FAST. Thus, it is recommended to * associate report rate with RateLvel statically for single sensor. */ @export(name="direct_rate_level_t", value_prefix="SENSOR_DIRECT_RATE_") enum RateLevel : int32_t { STOP, // stop NORMAL, // nominal 50Hz FAST, // nominal 200Hz VERY_FAST, // nominal 800Hz }; 3.2 具体hal实现可参考Android12源码中两个google的实现:device/generic/goldfish/sensors/device/google/trout/hal/sensors/2.0
2024年01月09日
36 阅读
0 评论
0 点赞
2024-01-02
此内容被密码保护
加密文章,请前往内页查看详情
2024年01月02日
12 阅读
0 评论
0 点赞
2023-12-29
此内容被密码保护
加密文章,请前往内页查看详情
2023年12月29日
5 阅读
0 评论
0 点赞
2023-12-27
此内容被密码保护
加密文章,请前往内页查看详情
2023年12月27日
12 阅读
0 评论
0 点赞
2023-12-21
此内容被密码保护
加密文章,请前往内页查看详情
2023年12月21日
4 阅读
0 评论
0 点赞
2023-12-14
常用的Android keyevent事件
keyevent1.keyevent事件有一张对应的表,可以直接发送对应的数字,也可以方式字符串,如下两个方法都能实现back键。打开cmd输入指令方法一:> adb shell input keyevent KEYCODE_BACK方法二:> adb shell input keyevent 42.常用的keyevent事件解锁(KEYCODE_NOTIFICATION): adb shell input keyevent 83向上(KEYCODE_DPAD_UP):adb shell input keyevent 19向下(KEYCODE_DPAD_DOWN):adb shell input keyevent 20向左(KEYCODE_DPAD_LEFT):adb shell input keyevent 21向右(KEYCODE_DPAD_RIGHT):adb shell input keyevent 22keyevent事件对应数字0 –> “KEYCODE_UNKNOWN” 1 –> “KEYCODE_MENU” 2 –> “KEYCODE_SOFT_RIGHT” 3 –> “KEYCODE_HOME” 4 –> “KEYCODE_BACK” 5 –> “KEYCODE_CALL” 6 –> “KEYCODE_ENDCALL” 7 –> “KEYCODE_0” 8 –> “KEYCODE_1” 9 –> “KEYCODE_2” 10 –> “KEYCODE_3” 11 –> “KEYCODE_4” 12 –> “KEYCODE_5” 13 –> “KEYCODE_6” 14 –> “KEYCODE_7” 15 –> “KEYCODE_8” 16 –> “KEYCODE_9” 17 –> “KEYCODE_STAR” 18 –> “KEYCODE_POUND” 19 –> “KEYCODE_DPAD_UP” 20 –> “KEYCODE_DPAD_DOWN” 21 –> “KEYCODE_DPAD_LEFT” 22 –> “KEYCODE_DPAD_RIGHT” 23 –> “KEYCODE_DPAD_CENTER” 24 –> “KEYCODE_VOLUME_UP” 25 –> “KEYCODE_VOLUME_DOWN” 26 –> “KEYCODE_POWER” 27 –> “KEYCODE_CAMERA” 28 –> “KEYCODE_CLEAR” 29 –> “KEYCODE_A” 30 –> “KEYCODE_B” 31 –> “KEYCODE_C” 32 –> “KEYCODE_D” 33 –> “KEYCODE_E” 34 –> “KEYCODE_F” 35 –> “KEYCODE_G” 36 –> “KEYCODE_H” 37 –> “KEYCODE_I” 38 –> “KEYCODE_J” 39 –> “KEYCODE_K” 40 –> “KEYCODE_L” 41 –> “KEYCODE_M” 42 –> “KEYCODE_N” 43 –> “KEYCODE_O” 44 –> “KEYCODE_P” 45 –> “KEYCODE_Q” 46 –> “KEYCODE_R” 47 –> “KEYCODE_S” 48 –> “KEYCODE_T” 49 –> “KEYCODE_U” 50 –> “KEYCODE_V” 51 –> “KEYCODE_W” 52 –> “KEYCODE_X” 53 –> “KEYCODE_Y” 54 –> “KEYCODE_Z” 55 –> “KEYCODE_COMMA” 56 –> “KEYCODE_PERIOD” 57 –> “KEYCODE_ALT_LEFT” 58 –> “KEYCODE_ALT_RIGHT” 59 –> “KEYCODE_SHIFT_LEFT” 60 –> “KEYCODE_SHIFT_RIGHT” 61 –> “KEYCODE_TAB” 62 –> “KEYCODE_SPACE” 63 –> “KEYCODE_SYM” 64 –> “KEYCODE_EXPLORER” 65 –> “KEYCODE_ENVELOPE” 66 –> “KEYCODE_ENTER” 67 –> “KEYCODE_DEL” 68 –> “KEYCODE_GRAVE” 69 –> “KEYCODE_MINUS” 70 –> “KEYCODE_EQUALS” 71 –> “KEYCODE_LEFT_BRACKET” 72 –> “KEYCODE_RIGHT_BRACKET” 73 –> “KEYCODE_BACKSLASH” 74 –> “KEYCODE_SEMICOLON” 75 –> “KEYCODE_APOSTROPHE” 76 –> “KEYCODE_SLASH” 77 –> “KEYCODE_AT” 78 –> “KEYCODE_NUM” 79 –> “KEYCODE_HEADSETHOOK” 80 –> “KEYCODE_FOCUS” 81 –> “KEYCODE_PLUS” 82 –> “KEYCODE_MENU” 83 –> “KEYCODE_NOTIFICATION” 84 –> “KEYCODE_SEARCH” 85 –> “TAG_LAST_KEYCODE”
2023年12月14日
27 阅读
0 评论
0 点赞
2023-11-24
此内容被密码保护
加密文章,请前往内页查看详情
2023年11月24日
10 阅读
0 评论
0 点赞
2023-11-23
此内容被密码保护
加密文章,请前往内页查看详情
2023年11月23日
11 阅读
0 评论
0 点赞
2023-11-14
uboot2021打开DEBUG
uboot中定义了很多DEBUG宏控制的打印,在调试一些模块时可以打开DEBUG宏,方便查找问题。打开方法在include/common.h头文件中定义这个宏即可,加上下面几行#ifndef DEBUG #define DEBUG #endif然后重新编译即可,编译的时候遇到一个小问题,提示一些符号找不到,看了下也不需要,直接注释掉了。diff --git a/drivers/video/vidconsole-uclass.c b/drivers/video/vidconsole-uclass.c index 3a07f36c..ee64fbdc 100644 --- a/drivers/video/vidconsole-uclass.c +++ b/drivers/video/vidconsole-uclass.c @@ -562,7 +562,7 @@ static void vidconsole_putc(struct stdio_dev *sdev, const char ch) ret = vidconsole_put_char(dev, ch); if (ret) { #ifdef DEBUG - console_puts_select_stderr(true, "[vc err: putc]"); +//console_puts_select_stderr(true, "[vc err: putc]"); #endif } video_sync(dev->parent, false); @@ -579,7 +579,7 @@ static void vidconsole_puts(struct stdio_dev *sdev, const char *s) char str[30]; snprintf(str, sizeof(str), "[vc err: puts %d]", ret); - console_puts_select_stderr(true, str); +// console_puts_select_stderr(true, str); #endif
2023年11月14日
31 阅读
0 评论
0 点赞
2023-09-19
kprobe简介
1. kprobe是什么?probe是linux内核的一个重要特性,是一个轻量级的内核调试工具,同时它又是其他一些更高级的内核调试工具(比如perf和systemtap)的“基础设施”,4.0版本的内核中,强大的eBPF特性也寄生于kprobe之上,所以kprobe在内核中的地位就可见一斑了。。利用kprobes技术,内核开发人员可以在内核的绝大多数指定函数中动态的插入探测点来收集所需的调试状态信息而基本不影响内核原有的执行流程。kprobes技术目前提供了3种探测手段:kprobe、jprobe和kretprobe,其中jprobe和kretprobe是基于kprobe实现的,他们分别应用于不同的探测场景中。如何高效地调试内核?printk是一种方法,但是printk终归是毫无选择地全量输出,某些场景下不实用,于是可以试一下tracepoint,使能tracepoint机制的时候才输出。对于傻傻地放置printk来输出信息的方式,tracepoint是个进步,但是tracepoint只是内核在某些特定行为(比如进程切换)上部署的一些静态锚点,这些锚点并不一定是你需要的,所以你仍然需要自己部署tracepoint,重新编译内核。那么kprobe的出现就很有必要了,它可以在运行的内核中动态插入探测点,执行预定义的操作。kprobes技术包括的3种探测手段分别时kprobe、jprobe和kretprobe。首先kprobe是最基本的探测方式,是实现后两种的基础,它可以在任意的位置放置探测点(就连函数内部的某条指令处也可以),它提供了探测点的调用前、调用后和内存访问出错3种回调方式,分别是pre_handler、post_handler和fault_handler,其中pre_handler函数将在被探测指令被执行前回调,post_handler会在被探测指令执行完毕后回调(注意不是被探测函数),fault_handler会在内存访问出错时被调用;jprobe基于kprobe实现,它用于获取被探测函数的入参值;最后kretprobe从名字种就可以看出其用途了,它同样基于kprobe实现,用于获取被探测函数的返回值。kprobes的技术原理并不仅仅包含存软件的实现方案,它也需要硬件架构提供支持。其中涉及硬件架构相关的是CPU的异常处理和单步调试技术,前者用于让程序的执行流程陷入到用户注册的回调函数中去,而后者则用于单步执行被探测点指令,因此并不是所有的架构均支持,目前kprobes技术已经支持多种架构,包括i386、x86_64、ppc64、ia64、sparc64、arm、ppc和mips(有些架构实现可能并不完全,具体可参考内核的Documentation/kprobes.txt)。kprobes的特点与使用限制:1、kprobes允许在同一个被被探测位置注册多个kprobe,但是目前jprobe却不可以;同时也不允许以其他的jprobe回掉函数和kprobe的post_handler回调函数作为被探测点。2、一般情况下,可以探测内核中的任何函数,包括中断处理函数。不过在kernel/kprobes.c和arch/*/kernel/kprobes.c程序中用于实现kprobes自身的函数是不允许被探测的,另外还有do_page_fault和notifier_call_chain;3、如果以一个内联函数为探测点,则kprobes可能无法保证对该函数的所有实例都注册探测点。由于gcc可能会自动将某些函数优化为内联函数,因此可能无法达到用户预期的探测效果;4、一个探测点的回调函数可能会修改被探测函数运行的上下文,例如通过修改内核的数据结构或者保存与struct pt_regs结构体中的触发探测之前寄存器信息。因此kprobes可以被用来安装bug修复代码或者注入故障测试代码;5、kprobes会避免在处理探测点函数时再次调用另一个探测点的回调函数,例如在printk()函数上注册了探测点,则在它的回调函数中可能再次调用printk函数,此时将不再触发printk探测点的回调,仅仅时增加了kprobe结构体中nmissed字段的数值;6、在kprobes的注册和注销过程中不会使用mutex锁和动态的申请内存;7、kprobes回调函数的运行期间是关闭内核抢占的,同时也可能在关闭中断的情况下执行,具体要视CPU架构而定。因此不论在何种情况下,在回调函数中不要调用会放弃CPU的函数(如信号量、mutex锁等);8、kretprobe通过替换返回地址为预定义的trampoline的地址来实现,因此栈回溯和gcc内嵌函数__builtin_return_address()调用将返回trampoline的地址而不是真正的被探测函数的返回地址;9、如果一个函数的调用此处和返回次数不相等,则在类似这样的函数上注册kretprobe将可能不会达到预期的效果,例如do_exit()函数会存在问题,而do_execve()函数和do_fork()函数不会;10、如果当在进入和退出一个函数时,CPU运行在非当前任务所有的栈上,那么往该函数上注册kretprobe可能会导致不可预料的后果,因此,kprobes不支持在X86_64的结构下为__switch_to()函数注册kretprobe,将直接返回-EINVAL。2. kprobe怎么使能?不同kernel版本可能不同,最好根据menuconfig配置需要打开如下kernel defconfig CONFIG_KPROBES=y CONFIG_FUNCTION_TRACER=y CONFIG_FTRACE_SYSCALLS=y 对应的配置项为: CONFIG_KPROBES=y CONFIG_KRETPROBES=y CONFIG_TRACING=y CONFIG_GENERIC_TRACER=y CONFIG_TRACING_SUPPORT=y CONFIG_FTRACE=y CONFIG_FUNCTION_TRACER=y CONFIG_FTRACE_SYSCALLS=y CONFIG_KPROBE_EVENTS=y 3. kprobe怎么使用?--模块加载的方式kprobe主要有两种使用方法,一是通过模块加载;二是通过debugfs接口。模块加载的方式:内核源码下有目录下 samples/kprobes,该目录下有kprobes的例子,可以仿照这些例子写自己的kprobe模块。以kprobe_example.c为例,首先声明一个kprobe结构体,然后定义其中几个关键成员变量,包括symbol_name,pre_handler,post_handler。其中,symbol_name是函数名(kprobe_example.c中该项为_do_fork),告诉内核我的探测点放置在了函数_do_fork处,pre_hander和post_hander分别表示在执行探测点之前和之后执行的钩子函数。然后通过register_kprobe函数注册kprobe即可。第一个例子,使用kprobe打印fork时的pc/* * NOTE: This example is works on x86 and powerpc. * Here's a sample kernel module showing the use of kprobes to dump a * stack trace and selected registers when _do_fork() is called. * * For more information on theory of operation of kprobes, see * Documentation/kprobes.txt * * You will see the trace data in /var/log/messages and on the console * whenever _do_fork() is invoked to create a new process. */ #include <linux/kernel.h> #include <linux/module.h> #include <linux/kprobes.h> #define MAX_SYMBOL_LEN 64 static char symbol[MAX_SYMBOL_LEN] = "_do_fork"; module_param_string(symbol, symbol, sizeof(symbol), 0644); /* 程序定义了一个struct kprobe结构体实例kp,并初始化了其中的symbol_name字段为do_fork;在驱动初始化函数中,将注册 * pre_handler,post_handler, fault_handler这三个回调函数为handler_pre,handler_post,handler_fault; * 最后调用register_kprobe注册。 */ /* For each probe you need to allocate a kprobe structure */ static struct kprobe kp = { .symbol_name = symbol, }; /* handler_pre回调函数的第一个入参是注册的struct kprobe,第二个参数是保存的触发断点前的寄存器状态。 * 它在do_fork函数被调用之前被调用,该函数仅仅是打印了被探测点的地址,保存个别寄存器参数。 */ /* kprobe pre_handler: called just before the probed instruction is executed */ static int handler_pre(struct kprobe *p, struct pt_regs *regs) { #ifdef CONFIG_ARM64 pr_info("<%s> pre_handler: p->addr = 0x%p, pc = 0x%lx," " pstate = 0x%lx\n", p->symbol_name, p->addr, (long)regs->pc, (long)regs->pstate); #endif /* A dump_stack() here will give a stack backtrace */ return 0; } // 该函数在do_fork函数调用之后被调用 /* kprobe post_handler: called after the probed instruction is executed */ static void handler_post(struct kprobe *p, struct pt_regs *regs, unsigned long flags) { #ifdef CONFIG_ARM64 pr_info("<%s> post_handler: p->addr = 0x%p, pstate = 0x%lx\n", p->symbol_name, p->addr, (long)regs->pstate); #endif } /* handler_fault回调函数会在执行handler_pre,handler_post或单步执行do_fork出现错误时调用, * 这里的第三个参数是发生错误时的trap number,与架构相关 */ /* * fault_handler: this is called if an exception is generated for any * instruction within the pre- or post-handler, or when Kprobes * single-steps the probed instruction. */ static int handler_fault(struct kprobe *p, struct pt_regs *regs, int trapnr) { pr_info("fault_handler: p->addr = 0x%p, trap #%dn", p->addr, trapnr); /* Return 0 because we don't handle the fault. */ return 0; } static int __init kprobe_init(void) { int ret; kp.pre_handler = handler_pre; kp.post_handler = handler_post; kp.fault_handler = handler_fault; ret = register_kprobe(&kp); if (ret < 0) { pr_err("register_kprobe failed, returned %d\n", ret); return ret; } pr_info("Planted kprobe at %p\n", kp.addr); return 0; } static void __exit kprobe_exit(void) { unregister_kprobe(&kp); pr_info("kprobe at %p unregistered\n", kp.addr); } module_init(kprobe_init) module_exit(kprobe_exit) MODULE_LICENSE("GPL"); 将kprobe_example.ko insmod进内核之后,每当系统新启动一个进程,比如执行ls,cat等,都会输出:[11573.615667] -(2)[2535:AudioPileline->1:init]<_do_fork> post_handler: p->addr = 0x0000000014fff252, pstate = 0x80400009 [11573.669603] -(3)[2535:AudioPileline->1:init]<_do_fork> pre_handler: p->addr = 0x0000000014fff252, pc = 0xffff0000080be50c, pstate = 0x80400009 [11573.682456] -(3)[2535:AudioPileline->1:init]<_do_fork> post_handler: p->addr = 0x0000000014fff252, pstate = 0x80400009 [11573.736206] -(3)[2535:AudioPileline->1:init]<_do_fork> pre_handler: p->addr = 0x0000000014fff252, pc = 0xffff0000080be50c, pstate = 0x80400009 [11573.749062] -(3)[2535:AudioPileline->1:init]<_do_fork> post_handler: p->addr = 0x0000000014fff252, pstate = 0x80400009 [11573.802870] -(3)[2535:AudioPileline->1:init]<_do_fork> pre_handler: p->addr = 0x0000000014fff252, pc = 0xffff0000080be50c, pstate = 0x80400009 [11573.815722] -(3)[2535:AudioPileline->1:init]<_do_fork> post_handler: p->addr = 0x0000000014fff252, pstate = 0x80400009第一行是执行pre_handler钩子函数的输出,第二行是执行post_handler钩子函数的输出,当然这些都是内核中案例的写法,你可以写自己的钩子函数。kretprobe例子,打印返回值和函数执行时间kretprobe是基于kprobe实现的,下面是一个例子/* * kretprobe_example.c * * Here's a sample kernel module showing the use of return probes to * report the return value and total time taken for probed function * to run. * * usage: insmod kretprobe_example.ko func=<func_name> * * If no func_name is specified, _do_fork is instrumented * * For more information on theory of operation of kretprobes, see * Documentation/kprobes.txt * * Build and insert the kernel module as done in the kprobe example. * You will see the trace data in /var/log/messages and on the console * whenever the probed function returns. (Some messages may be suppressed * if syslogd is configured to eliminate duplicate messages.) */ #include <linux/kernel.h> #include <linux/module.h> #include <linux/kprobes.h> #include <linux/ktime.h> #include <linux/limits.h> #include <linux/sched.h> static char func_name[NAME_MAX] = "_do_fork"; module_param_string(func, func_name, NAME_MAX, S_IRUGO); MODULE_PARM_DESC(func, "Function to kretprobe; this module will report the" " function's execution time"); /* per-instance private data */ struct my_data { ktime_t entry_stamp; }; /* Here we use the entry_hanlder to timestamp function entry */ static int entry_handler(struct kretprobe_instance *ri, struct pt_regs *regs) { struct my_data *data; if (!current->mm) return 1; /* Skip kernel threads */ data = (struct my_data *)ri->data; data->entry_stamp = ktime_get(); return 0; } /* * Return-probe handler: Log the return value and duration. Duration may turn * out to be zero consistently, depending upon the granularity of time * accounting on the platform. */ static int ret_handler(struct kretprobe_instance *ri, struct pt_regs *regs) { unsigned long retval = regs_return_value(regs); struct my_data *data = (struct my_data *)ri->data; s64 delta; ktime_t now; now = ktime_get(); delta = ktime_to_ns(ktime_sub(now, data->entry_stamp)); pr_info("%s returned %lu and took %lld ns to execute\n", func_name, retval, (long long)delta); return 0; } static struct kretprobe my_kretprobe = { .handler = ret_handler, .entry_handler = entry_handler, .data_size = sizeof(struct my_data), /* Probe up to 20 instances concurrently. */ .maxactive = 20, }; static int __init kretprobe_init(void) { int ret; my_kretprobe.kp.symbol_name = func_name; ret = register_kretprobe(&my_kretprobe); if (ret < 0) { pr_err("register_kretprobe failed, returned %d\n", ret); return -1; } pr_info("Planted return probe at %s: %p\n", my_kretprobe.kp.symbol_name, my_kretprobe.kp.addr); return 0; } static void __exit kretprobe_exit(void) { unregister_kretprobe(&my_kretprobe); pr_info("kretprobe at %p unregistered\n", my_kretprobe.kp.addr); /* nmissed > 0 suggests that maxactive was set too low. */ pr_info("Missed probing %d instances of %s\n", my_kretprobe.nmissed, my_kretprobe.kp.symbol_name); } module_init(kretprobe_init) module_exit(kretprobe_exit) MODULE_LICENSE("GPL");运行模块,如下,我们监视ion_carveout_heap_allocate这个函数的返回值和运行时间。可以判断出通过ion分配内存所需要的时间console:/ # insmod kretprobe_example.ko func=ion_carveout_heap_allocate [12177.111236] -(1)[2655:HwBinder:2427_3->1:init]ion_carveout_heap_allocate returned 0 and took 10417 ns to execute [12177.123240] -(0)[2655:HwBinder:2427_3->1:init]ion_carveout_heap_allocate returned 0 and took 10583 ns to execute [12177.139424] -(0)[2655:HwBinder:2427_3->1:init]ion_carveout_heap_allocate returned 0 and took 10667 ns to execute [12177.152293] -(1)[2655:HwBinder:2427_3->1:init]ion_carveout_heap_allocate returned 0 and took 10292 ns to execute [12177.164249] -(2)[2655:HwBinder:2427_3->1:init]ion_carveout_heap_allocate returned 0 and took 11667 ns to execute [12177.176606] -(0)[2655:HwBinder:2427_3->1:init]ion_carveout_heap_allocate returned 0 and took 46666 ns to execute [12177.190549] -(3)[2655:HwBinder:2427_3->1:init]ion_carveout_heap_allocate returned 0 and took 27083 ns to execute [12177.202639] -(0)[2655:HwBinder:2427_3->1:init]ion_carveout_heap_allocate returned 0 and took 11292 ns to execute [12177.214691] -(2)[2655:HwBinder:2427_3->1:init]ion_carveout_heap_allocate returned 0 and took 12083 ns to execute 4. kprobe结构体与API介绍先看kprobe这个结构体的成员变量,struct kprobe { struct hlist_node hlist; /* list of kprobes for multi-handler support */ struct list_head list; /*count the number of times this probe was temporarily disarmed */ unsigned long nmissed; /* location of the probe point */ kprobe_opcode_t *addr; /* Allow user to indicate symbol name of the probe point */ const char *symbol_name; /* Offset into the symbol */ unsigned int offset; /* Called before addr is executed. */ kprobe_pre_handler_t pre_handler; /* Called after addr is executed, unless... */ kprobe_post_handler_t post_handler; /* * ... called if executing addr causes a fault (eg. page fault). * Return 1 if it handled fault, otherwise kernel will see it. */ kprobe_fault_handler_t fault_handler; /* Saved opcode (which has been replaced with breakpoint) */ kprobe_opcode_t opcode; /* copy of the original instruction */ struct arch_specific_insn ainsn; /* * Indicates various status flags. * Protected by kprobe_mutex after this kprobe is registered. */ u32 flags; }; 其中各个字段的含义如下:struct hlist_node hlist:被用于kprobe全局hash,索引值为被探测点的地址;struct list_head list:用于链接同一被探测点的不同探测kprobe;kprobe_opcode_t *addr:被探测点的地址;const char *symbol_name:被探测函数的名字;unsigned int offset:被探测点在函数内部的偏移,用于探测函数内部的指令,如果该值为0表示函数的入口;kprobe_pre_handler_t pre_handler:在被探测点指令执行之前调用的回调函数;kprobe_post_handler_t post_handler:在被探测指令执行之后调用的回调函数;kprobe_fault_handler_t fault_handler:在执行pre_handler、post_handler或单步执行被探测指令时出现内存异常则会调用该回调函数;kprobe_break_handler_t break_handler:在执行某一kprobe过程中触发了断点指令后会调用该函数,用于实现jprobe;kprobe_opcode_t opcode:保存的被探测点原始指令;struct arch_specific_insn ainsn:被复制的被探测点的原始指令,用于单步执行,架构强相关(可能包含指令模拟函数);u32 flags:状态标记。涉及的API函数接口如下:int register_kprobe(struct kprobe *kp) //向内核注册kprobe探测点 void unregister_kprobe(struct kprobe *kp) //卸载kprobe探测点 int register_kprobes(struct kprobe **kps, int num) //注册探测函数向量,包含多个探测点 void unregister_kprobes(struct kprobe **kps, int num) //卸载探测函数向量,包含多个探测点 int disable_kprobe(struct kprobe *kp) //临时暂停指定探测点的探测 int enable_kprobe(struct kprobe *kp) //恢复指定探测点的探测5. kprobe怎么使用?--使用kprobe on ftrace模块加载的终究不是很方便,尤其对于一些不带gcc的嵌入式系统,需要交叉编译ko,将ko拷贝到单板,然后insmod,不太方便。debugfs下(确切地说,应该是ftrace)提供了一套注册、使能、注销kprobe的接口,可以很方便地操作kprobe。用法如下:需要打开如下kernel config,打开"General setup"->"Kprobes",以及"Kernel hacking"->"Tracers"->"Enable kprobes-based dynamic events"。CONFIG_KPROBES=y CONFIG_OPTPROBES=y CONFIG_KPROBES_ON_FTRACE=y CONFIG_UPROBES=y CONFIG_KRETPROBES=y CONFIG_HAVE_KPROBES=y CONFIG_HAVE_KRETPROBES=y CONFIG_HAVE_OPTPROBES=y CONFIG_HAVE_KPROBES_ON_FTRACE=y CONFIG_KPROBE_EVENT=y使能ftrace有些系统没有挂载debugfs,需要先挂载下;然后再使能ftracecd /sys/kernel/debug/tracing mount -t debugfs nodev /sys/kernel/debug echo 1 > tracing_on注册kprobe事件进入到tracing目录,这里就是传说中ftrace的天下了,执行echo "p:sys_write_event ksys_write" > kprobe_events向kprobe_events写入"p:sys_write ksys_write",注册kprobe事件。你会发现,当前目录下的events下,新增一个kprobes目录,该目录下:evb:/sys/kernel/debug/tracing # ls events/kprobes/ enable filter sys_write_event即,我们注册的kprobe事件生效了。那么"p:sys_write_event ksys_write"是什么意思呢?首先p表示我们要注册一个kprobe,如果要注册retprobe,此处应为r;sys_write_event表示这个kprobe叫什么名字;ksys_write表示我们的插入点在哪里。那么,"p:sys_write_event ksys_write"的语义就很明显了:在函数ksys_write处插入一个kprobe点,这个点的名字叫sys_write_event。3.使能kprobe向该events中的enable节点写入1,然后再cat 下trace节点,即可看到evb:/sys/kernel/debug/tracing # echo 1 > events/kprobes/sys_write_event/enable evb:/sys/kernel/debug/tracing # cat trace # tracer: nop # # entries-in-buffer/entries-written: 1276/7596 #P:4 # # _-----=> irqs-off # / _----=> need-resched # | / _---=> hardirq/softirq # || / _--=> preempt-depth # ||| / delay # TASK-PID CPU# |||| TIMESTAMP FUNCTION # | | | |||| | | mali-cmar-backe-7239 [002] d... 5020.025131: sys_write_event: (ksys_write+0x0/0xd8) mali-cmar-backe-7239 [002] d... 5020.025149: sys_write_event: (ksys_write+0x0/0xd8) mali-cmar-backe-7239 [002] d... 5020.025157: sys_write_event: (ksys_write+0x0/0xd8) mali-cmar-backe-7239 [002] d... 5020.025342: sys_write_event: (ksys_write+0x0/0xd8) mali-cmar-backe-7239 [002] d... 5020.025410: sys_write_event: (ksys_write+0x0/0xd8) Colors-12808 [002] d... 5020.036317: sys_write_event: (ksys_write+0x0/0xd8) Colors-12808 [002] d... 5020.041591: sys_write_event: (ksys_write+0x0/0xd8) Colors-12808 [002] d... 5020.041673: sys_write_event: (ksys_write+0x0/0xd8) Colors-12808 [002] d... 5020.041808: sys_write_event: (ksys_write+0x0/0xd8) Colors-12808 [002] d... 5020.049699: sys_write_event: (ksys_write+0x0/0xd8) Colors-12808 [002] d... 5020.052805: sys_write_event: (ksys_write+0x0/0xd8) Colors-12808 [002] d... 5020.054392: sys_write_event: (ksys_write+0x0/0xd8) Colors-12808 [002] d... 5020.054486: sys_write_event: (ksys_write+0x0/0xd8) Colors-12808 [002] d... 5020.054580: sys_write_event: (ksys_write+0x0/0xd8) TimerDispatch-2579 [002] d... 5020.067048: sys_write_event: (ksys_write+0x0/0xd8) Colors-12808 [002] d... 5020.086188: sys_write_event: (ksys_write+0x0/0xd8) Colors-12808 [002] d... 5020.099746: sys_write_event: (ksys_write+0x0/0xd8) sh-2728 [002] d... 5020.136629: sys_write_event: (ksys_write+0x0/0xd8)输出说明:pid为7239的进程,在自本次开机5020.025131秒的时候,调用了一次函数ksys_write。5.关闭kprobe先关闭kprobeevb:/sys/kernel/debug/tracing # echo 0 > events/kprobes/sys_write_event/enable 再注销kprobe,evb:/sys/kernel/debug/tracing # echo "-:kprobes/sys_write_event" > kprobe_events通过这个例子,我们可以对基于ftrace使用kprobe有个直观的感受。6. kprobe事件配置kprobe事件相关的节点有如下:/sys/kernel/debug/tracing/kprobe_events-----------------------配置kprobe事件属性,增加事件之后会在kprobes下面生成对应目录。 /sys/kernel/debug/tracing/kprobe_profile----------------------kprobe事件统计属性文件。 /sys/kernel/debug/tracing/kprobes/<GRP>/<EVENT>/enabled-------使能kprobe事件 /sys/kernel/debug/tracing/kprobes/<GRP>/<EVENT>/filter--------过滤kprobe事件 /sys/kernel/debug/tracing/kprobes/<GRP>/<EVENT>/format--------查询kprobe事件显示格式新增一个kprobes事件,通过写kprobe_events来设置。kprobe_events文件支持3中格式的输入:p[:[GRP/]EVENT] [MOD:]SYM[+offs]|MEMADDR [FETCHARGS]-------------------设置一个probe探测点 r[:[GRP/]EVENT] [MOD:]SYM[+0] [FETCHARGS]------------------------------设置一个return probe探测点 -:[GRP/]EVENT----------------------------------------------------------删除一个探测点解释如下:GRP : Group name. If omitted, use "kprobes" for it.------------设置后会在events/kprobes下创建<GRP>目录。 EVENT : Event name. If omitted, the event name is generated based on SYM+offs or MEMADDR.---指定后在events/kprobes/<GRP>生成<EVENT>目录。 MOD : Module name which has given SYM.--------------------------模块名,一般不设 SYM[+offs] : Symbol+offset where the probe is inserted.-------------被探测函数名和偏移 MEMADDR : Address where the probe is inserted.----------------------指定被探测的内存绝对地址 FETCHARGS : Arguments. Each probe can have up to 128 args.----------指定要获取的参数信息。 %REG : Fetch register REG---------------------------------------获取指定寄存器值 @ADDR : Fetch memory at ADDR (ADDR should be in kernel)--------获取指定内存地址的值 @SYM[+|-offs] : Fetch memory at SYM +|- offs (SYM should be a data symbol)---获取全局变量的值 $stackN : Fetch Nth entry of stack (N >= 0)----------------------------------获取指定栈空间值,即sp寄存器+N后的位置值 $stack : Fetch stack address.-----------------------------------------------获取sp寄存器值 $retval : Fetch return value.(*)--------------------------------------------获取返回值,用户return kprobe $comm : Fetch current task comm.----------------------------------------获取对应进程名称。 +|-offs(FETCHARG) : Fetch memory at FETCHARG +|- offs address.(**)------------- NAME=FETCHARG : Set NAME as the argument name of FETCHARG. FETCHARG:TYPE : Set TYPE as the type of FETCHARG. Currently, basic types (u8/u16/u32/u64/s8/s16/s32/s64), hexadecimal types (x8/x16/x32/x64), "string" and bitfield are supported.----------------设置参数的类型,可以支持字符串和比特类型 (*) only for return probe. (**) this is useful for fetching a field of data structures.执行如下两条命令就会生成目录/sys/kernel/debug/tracing/events/kprobes/myprobe;第三条命令则可以删除指定kprobe事件,如果要全部删除则echo > /sys/kernel/debug/tracing/kprobe_events。echo 'p:myprobe do_sys_open dfd=%ax filename=%dx flags=%cx mode=+4($stack)' > /sys/kernel/debug/tracing/kprobe_events echo 'r:myretprobe do_sys_open ret=$retval' >> /sys/kernel/debug/tracing/kprobe_events-----------------------------------------------------这里面一定要用">>",不然就会覆盖前面的设置。 echo '-:myprobe' >> /sys/kernel/debug/tracing/kprobe_events echo '-:myretprobe' >> /sys/kernel/debug/tracing/kprobe_events参数后面的寄存器是跟架构相关的,%ax、%dx、%cx表示第1/2/3个参数,超出部分使用$stack来存储参数。函数返回值保存在$retval中。对kprobe事件的是能通过往对应事件的enable写1开启探测;写0暂停探测。echo 1 > /sys/kernel/debug/tracing/trace echo 'p:myprobe do_sys_open dfd=%ax filename=%dx flags=%cx mode=+4($stack)' > /sys/kernel/debug/tracing/kprobe_events echo 'r:myretprobe do_sys_open ret=$retval' >> /sys/kernel/debug/tracing/kprobe_events echo 1 > /sys/kernel/debug/tracing/events/kprobes/myprobe/enable echo 1 > /sys/kernel/debug/tracing/events/kprobes/myretprobe/enable ls echo 0 > /sys/kernel/debug/tracing/events/kprobes/myprobe/enable echo 0 > /sys/kernel/debug/tracing/events/kprobes/myretprobe/enable cat /sys/kernel/debug/tracing/trace然后在/sys/kernel/debug/tracing/trace中可以看到结果。sourceinsight4.-3356 [000] .... 3542865.754536: myprobe: (do_sys_open+0x0/0x290) dfd=0xffffffffbd6764a0 filename=0x8000 flags=0x1b6 mode=0xe3afff48ffffffff bash-26041 [001] .... 3542865.757014: myprobe: (do_sys_open+0x0/0x290) dfd=0xffffffffbd676460 filename=0x8241 flags=0x1b6 mode=0xe0c0ff48ffffffff ls-18078 [005] .... 3542865.757950: myprobe: (do_sys_open+0x0/0x290) dfd=0xffffffffbd676460 filename=0x88000 flags=0x1 mode=0xc1b7bf48ffffffff ls-18078 [005] d... 3542865.757953: myretprobe: (SyS_open+0x1e/0x20 <- do_sys_open) ret=0x3 ls-18078 [005] .... 3542865.757966: myprobe: (do_sys_open+0x0/0x290) dfd=0xffffffffbd676460 filename=0x88000 flags=0x6168 mode=0xc1b7bf48ffffffff ls-18078 [005] d... 3542865.757969: myretprobe: (SyS_open+0x1e/0x20 <- do_sys_open) ret=0x3 ls-18078 [005] .... 3542865.758001: myprobe: (do_sys_open+0x0/0x290) dfd=0xffffffffbd676460 filename=0x88000 flags=0x6168 mode=0xc1b7bf48ffffffff ls-18078 [005] d... 3542865.758004: myretprobe: (SyS_open+0x1e/0x20 <- do_sys_open) ret=0x3 ls-18078 [005] .... 3542865.758030: myprobe: (do_sys_open+0x0/0x290) dfd=0xffffffffbd676460 filename=0x88000 flags=0x1000 mode=0xc1b7bf48ffffffff ls-18078 [005] d... 3542865.758033: myretprobe: (SyS_open+0x1e/0x20 <- do_sys_open) ret=0x3 ls-18078 [005] .... 3542865.758055: myprobe: (do_sys_open+0x0/0x290) dfd=0xffffffffbd676460 filename=0x88000 flags=0x1000 mode=0xc1b7bf48ffffffff ls-18078 [005] d... 3542865.758057: myretprobe: (SyS_open+0x1e/0x20 <- do_sys_open) ret=0x3 ls-18078 [005] .... 3542865.758080: myprobe: (do_sys_open+0x0/0x290) dfd=0xffffffffbd676460 filename=0x88000 flags=0x19d0 mode=0xc1b7bf48ffffffff ls-18078 [005] d... 3542865.758082: myretprobe: (SyS_open+0x1e/0x20 <- do_sys_open) ret=0x3 ls-18078 [005] .... 3542865.758289: myprobe: (do_sys_open+0x0/0x290) dfd=0xffffffffbd676460 filename=0x8000 flags=0x1b6 mode=0xc1b7bf48ffffffff ls-18078 [005] d... 3542865.758297: myretprobe: (SyS_open+0x1e/0x20 <- do_sys_open) ret=0x3 ls-18078 [005] .... 3542865.758339: myprobe: (do_sys_open+0x0/0x290) dfd=0xffffffffbd676460 filename=0x88000 flags=0x0 mode=0xc1b7bf48ffffffff ls-18078 [005] d... 3542865.758343: myretprobe: (SyS_open+0x1e/0x20 <- do_sys_open) ret=0x3 ls-18078 [005] .... 3542865.758444: myprobe: (do_sys_open+0x0/0x290) dfd=0xffffffffbd676460 filename=0x98800 flags=0x2 mode=0xc1b7bf48ffffffff ls-18078 [005] d... 3542865.758446: myretprobe: (SyS_open+0x1e/0x20 <- do_sys_open) ret=0x3 bash-26041 [001] .... 3542865.760416: myprobe: (do_sys_open+0x0/0x290) dfd=0xffffffffbd676460 filename=0x8241 flags=0x1b6 mode=0xe0c0ff48ffffffff bash-26041 [001] d... 3542865.760426: myretprobe: (SyS_open+0x1e/0x20 <- do_sys_open) ret=0x3 bash-26041 [001] d... 3542865.793477: myretprobe: (SyS_open+0x1e/0x20 <- do_sys_open) ret=0x3kprobe事件过滤跟踪函数需要通过filter进行过滤,可以有效过滤掉冗余信息。filter文件用于设置过滤条件,可以减少trace中输出的信息,它支持的格式和c语言的表达式类似,支持 ==,!=,>,<,>=,<=判断,并且支持与&&,或||,还有()。echo 'filename==0x8241' > /sys/kernel/debug/tracing/events/kprobes/myprobe/filterkprobe和栈配合使用如果要在显示函数的同时显示其栈信息,可以通过配置trace_options来达到。echo stacktrace > /sys/kernel/debug/tracing/trace_optionskprobe_profile统计信息获取一段kprobe时间之后,可以再kprobe_profile中查看统计信息。后面两列分别表示命中和未命中的次数。cat /sys/kernel/debug/tracing/kprobe_profile myprobe7. do_fork()函数实例8. kprobe原理9. kprobes的特定与使用限制
2023年09月19日
96 阅读
0 评论
0 点赞
1
2
...
11